Banning a bot IP that iptables could not ban
| 2715 words | 13 minutes
Recently, I was configuring fail2ban on a server and testing that it actually works by looking at incoming logs. Thankfully, there were a few bots that consistently hit the server, so I had plenty of testers. However, the was one bot that I simply could not block! This post describes how I came to understand why I wasn’t able to block that one IP and how I managed to block it in the end. (Note: I’m far from a networking expert, so for advanced readers might find the conclusion obvious).
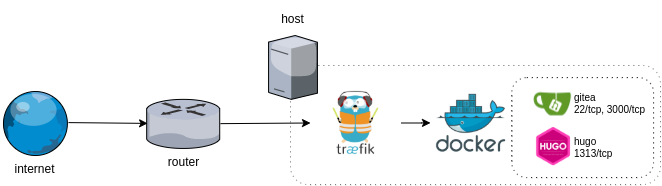
The server we’re interested in this case hosts a gitea instance, which has both HTTP and SSH services. The same server hosts other services, so for the easy maintenance, gitea is deployed as a docker container and sits behind traefik, a reverse proxy that handles TLS termination, which is also deployed as a container.
Part 1: Early wins with SSH
I started from gitea’s SSH service. As I understand it, fail2ban configuration consists of few components – how to find the logs, how to parse them, and how to ban specific IPs.
As docker is configured to send the logs to journald and fail2ban has support for systemd backend, defining the log source is as easy as setting backend = systemd. However, this configuration alone would require fail2ban to parse all system logs, most of which are not really required here. There’s multiple ways to filter journal data, but to find the relevant keys and values, one can use -o json-pretty output mode (some output omitted for brevity):
| |
For this case, we’re interested in logs for specific docker container, so we can define the filter as follows.
| |
Next, parsing the logs is a matter of defining failregex and ignoreregex parameters. To validate that the regexes are picking what they need to pick, use fail2ban-regex with --print-all-missed.
| |
This way I found that the regexes in default sshd jail didn’t work in this case and I ended up slightly modifying this gist to arrive at a working configuration. All in all, the gitea-ssh specific configuration looked as such:
File: /etc/fail2ban/filter.d/gitea-sshd.conf
| |
File: /etc/fail2ban/jail.d/gitea-jail.local
| |
File: /etc/fail2ban/action.d/docker-action.conf
| |
And that… seemed to work! 🎉 (Note, all IPs in this post are redacted.)
| |
Part 2: HTTP is going to be easy
Similar configurations were then applied to the HTTP service. The logs now come from an access.log written by traefik and fail2ban reads it and bans IP based on that. Easy!
fail2ban.filter: INFO [traefik-botsearch] Found 51.0.0.0 - 2023-09-06 23:32:19
fail2ban.actions: WARNING [traefik-botsearch] 51.0.0.0 already banned
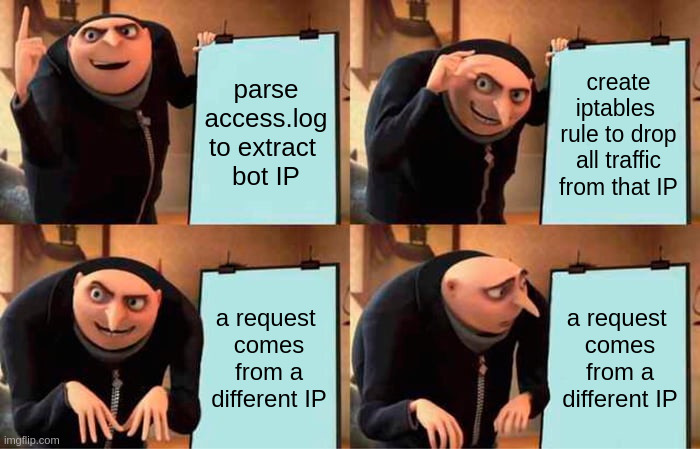
Wait a minute… WARNING: already banned means that fail2ban has already banned the IP in the past, but that IP can still access the resource, thus ending up again in the logs, which are parsed by fail2ban. So, something’s not right here. 🤔
Good thing here was that there was a particularly insisting bot that continuously spammed the same request with a period of 1-2 hours. This bot proved to be a good testing companion, as that period was enough for me to think about new ideas and implement them before the next request would come again… and pass through fail2ban again!
143.0.0.0 - - [06/Sep/2023:02:27:15 +0000] "GET / HTTP/1.1" 404 19 "-" "Mozilla/5.0 (iPhone; CPU iPhone OS 16_1 like Mac OS X) AppleWebKit/605.1.15 (KHTML, like Gecko) Version/16.1 Mobile/15E148 Safari/604.1" 834 "-" "-" 0ms
Part 3: Checking iptables rules
Let’s see… if fail2ban is able to notice all of this, then it’s not an issue with parsing configuration. As defined in the docker-action.conf (see above), the ban and unban actions insert and delete entries in the iptables’ DOCKER-USER chain. Let’s verify that these rules are actually created:
| |
Yeah, the rules are created alright. The same command can be augmented to show packet information:
| |
Here it shows that some of the rules are getting used, as iptables has registered non-zero packet statistics on those rules. That is, fail2ban successfully creates iptables rules and iptables successfully uses them to drop traffic from specific hosts… However, the bot IP we’re interested in doesn’t register any packets – traefik continues to log a single request from that IP, approximately once per hour, and iptables shows:
| |
Okay… 🤔 so, what if the rules are arranged in a manner that this request is able to hit a previous rule, and get a pass that way? iptables is actually a collection of tables and chains, with two main independent paths: through INPUT or through FORWARD. The DOCKER-USER chain is part of the FORWARD chain, so maybe the packets pass through INPUT chain and hence also pass the filters…?
There seems to be a lot of different options and solutions that different folks suggest to debug iptables routing (ref1, ref2, ref3, ref4). Not all of those solutions seemed to work for my system, but here’s some of the commands I executed, for your inspiration. Some of these may work, some may not. This area is the most unclear to me.
| |
Nevertheless, I was able to capture and view a single packet of my own, destined for the docker container. There’s a lot of info, but one thing is clear – the packet goes into FORWARD chain and then immediately jumps to DOCKER-USER chain. So, if my packets destined for the docker container end up in the correct chains, then it’s probable that the bot’s packets also pass through. In short, there’s absolutely no issue with iptables rules…
| |
Okay, let’s recap. There’s a bot sending HTTP requests to traefik and ending up in the access.logs. We can notice this with fail2ban and create iptables rules to block it, but that does absolutely nothing to stop the bot. There aren’t many ideas left to investigate. So, what if we’ll catch the packets as they are and see if their contents can tell us something?
Part 4: Using tcpdump to see the magic packets
Let’s use tcpdump to capture traffic with the specific bot IP and compare against access.log timestamps.
| |
After a while, the access.log shows a new request… and tcpdump remains quiet. Waaait, what. How is it possible that a packet arrives but skips all the iptables rules and all of the tcpdump things and just magically appears in the access.log?? Let’s remove the filter and see what else is happening on the same machine at the same time.
| |
After a while, a new request comes and is logged to access.log. Okay, open that pcap in wireshark and there’s one HTTP request with the same headers. Looks promising so far. wireshark can show the whole TCP stream as a single conversation, so let’s open that up and see:
| |
The bot IP is there!!
And it’s proxied!!
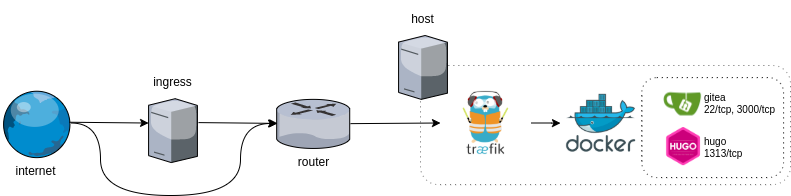
And 178.0.0.0 is IP of an ingress server!!
There was one crucial detail to all of this that I forgot completely – that I had an ingress server. That was one piece of this infrastructure which I setup long time ago in the cloud and forgot about it as it didn’t require any changes. The ingress server proxies 80/443 to the traefik and that’s it, that’s all it does. It wraps the request with PROXY protocol and traefik unwraps it, and therefore, the access logs show the client IP, even through traefik only communicates with the ingress. So, that’s the reason why iptables rules didn’t work. 🤦
Curiously, the SSH fail2ban rules worked because of misconfiguration of the DNS records. You see, they were configured to skip the ingress server entirely. Hence, the gitea ssh server communicated directly with the clients, without any PROXY protocol stuff.
Part 5: SSH and PROXY protocol
Alright, all of this setup was surprising and not really that great, so let’s do some cleanup. There’s two improvements to be made here. First, the ingress server should be used for all traffic, so it should also forward SSH traffic. Second, fail2ban should be configured properly. And that’s it. But there’s an issue – OpenSSH doesn’t handle PROXY protocol. And even if it did, traefik host cannot do much with fail2ban because all traffic comes from the ingress. Let’s first focus on proxying SSH traffic. To solve this, I tried couple of things.
For one, using traefik itself to unwrap TCP stream destined for the SSH service works – but as the traefik host initiates a new connection by doing so, the SSH service sees the traefik host IP as the client. Hence, this solution will not work with fail2ban.
Then, gitea seems to support PROXY protocol as well. However, there seems to be some usability issues with the official gitea/gitea docker container – by default, it seems to use “normal” OpenSSH, but gitea itself can also act as an SSH server. So, START_SSH_SERVER=true breaks the container, as there’s now two SSH servers fighting for one port. There doesn’t seem to be an option to disable the OpenSSH server, to replace it with the one from gitea. And the OpenSSH server doesn’t know how to handle PROXY protocol:
| |
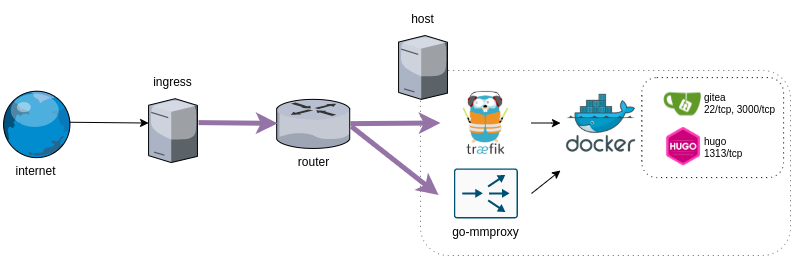
Next, I found of mmproxy and its alternative go-mmproxy. There’s a blog post that goes into more detail, but the main point is that this proxy unwraps the PROXY protocol and spoofs the source IP, transparently. That is, any TCP application will “just work” with such a proxy between the ingress and the application. After setting go-mmproxy up, I saw following logs:
| |
The 172.17.0.1 is a docker internal IP. That is, go-mmproxy unwraps the PROXY protocol and sends it to docker which now acts as if it was representing the end user. To fix this, the gitea container had to be moved to the host network instead. After all of the changes, the logs show that gitea’s SSH service can correctly see the actual client IP. (d8744aef4ef8 is the gitea container.)
| |
File: /etc/nginx/nginx.conf
| |
File: /etc/systemd/system/go-mmproxy.service
Based on the official go-mmproxy.service.example, with only ExecStart changed to:
| |
Part 6: Wiring up fail2ban with ingress server
The final piece of the puzzle is to have ingress server somehow made aware of the improper use of resources happening on the application servers. Otherwise, ingress server doesn’t have context to block anything. And application servers cannot block anything, as all traffic comes from one host. The solution is to transfer the context data somehow and there are similar solutions done for Cloudflare: ref1, ref2.
A new application is deployed on the ingress server, with its only purpose to provide access to local fail2ban-client to external users. This doesn’t really require much, so below is its full source. It’s then wrapped into a systemd service and managed automatically henceforth.
| |
And fail2ban on the application server’s side is extended with a new action, which connects to the server above to ban/unban specific IPs.
| |
The connection between these two is naturally kept private with a VPN tunnel. But overall, that’s all there is to make application server’s fail2ban and ingress server’s fail2ban work together.
In the end, I also moved the SSH services away from the default 22, which probably was more effective at reducing log spam than anything else outlined in this post. But overall, there’s definitely a lot I’ve learned working with different tools and PROXY protocol in practice.